Linear Regression in a different way
Trying to implement linear regression for a simple dataset without using existing regression library functions or the Gradient Decent Technique
Theory
Regression
A method of establishing relationship between 1 or more independant variables against one dependant variable
Linear Regression
Establishing a Linear relationship
Let’s try implementing the same:
Import the Google Drive to access your dataset
1
2
3
| from google.colab import drive
drive.mount('/content/drive')
|
Drive already mounted at /content/drive; to attempt to forcibly remount, call drive.mount("/content/drive", force_remount=True).
1
2
| import numpy as np
import pandas as pd
|
Reading the data
1
| df = pd.read_csv('/content/drive/My Drive/slr_data.csv')
|
.dataframe tbody tr th {
    vertical-align: top;
}

.dataframe thead th {
    text-align: right;
}
.dataframe tbody tr th {
    vertical-align: top;
}

.dataframe thead th {
    text-align: right;
}
1
2
| import matplotlib.pyplot as plt
import seaborn as sns
|
1
2
3
4
5
| plt.figure(figsize = (20,10))
sns.relplot(x = 'x', y = 'y', data = df)
plt.show()
|
<Figure size 1440x720 with 0 Axes>
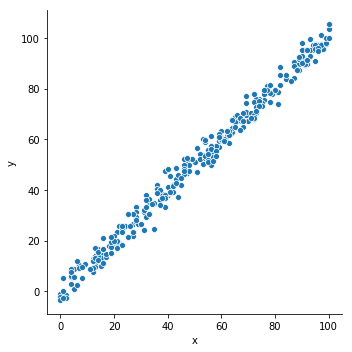
Linear Regression is all about finding a straight line that has the least Root Mean Square Value for the given data points => the line is to be existing between the extreme Y values to make sure the line is between the points in a given dataset
105.5918375
-3.4678837889999996
1
| y_mid = (y_max + y_min) / 2
|
51.0619768555
87
55
1
| y2 = df.y[df.x.idxmax()]
|
1
| y1 = df.y[df.x.idxmin()]
|
105.5918375
-1.040114209
1
| slope_m = (y2 - y1) / (x2 - x1)
|
1.06631951709
1
2
| def lin_equ(x):
return slope_m*(x - (df.x[df.y.idxmax()] + df.x[df.y.idxmin()]) / 2) + (df.y[df.y.idxmax()] + df.y[df.y.idxmin()]) / 2
|
.dataframe tbody tr th {
    vertical-align: top;
}

.dataframe thead th {
    text-align: right;
}
79.85260381693
20.13871085989
21.20503037698
19.0723913428
36.13350361624
1
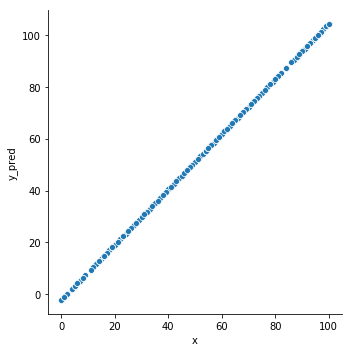
| df['y_pred'] = pd.Series(map(lin_equ, df.x.values))
|
.dataframe tbody tr th {
    vertical-align: top;
}

.dataframe thead th {
    text-align: right;
}
1
2
3
4
5
| plt.figure(figsize = (20,15))
sns.relplot(x = 'x', y = 'y_pred', data = df)
plt.show()
|
<Figure size 1440x1080 with 0 Axes>
1
2
3
4
5
6
7
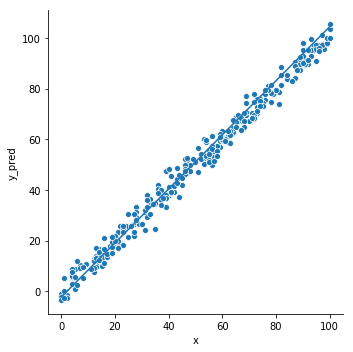
| plt.figure(figsize = (20,15))
sns.relplot(x = 'x', y = 'y', data = df)
sns.lineplot(x = 'x', y = 'y_pred', data = df)
plt.show()
|
<Figure size 1440x1080 with 0 Axes>
1
| neg_err_sum = sum([i*i for i in df.y_pred-df.y if i < 0])
|
1
| pos_err_sum = sum([i*i for i in df.y_pred-df.y if i >= 0])
|
1228.4737143905872
2396.9837025596657